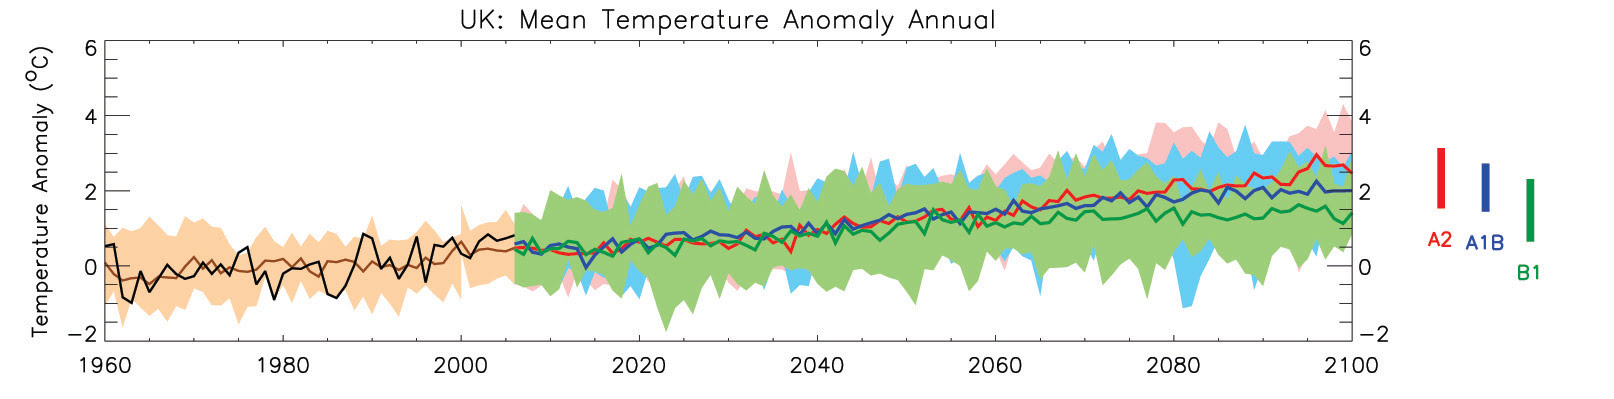
- This graph shows the ‘precipitation anomaly’ – the difference in rain or snowfall to the 1970-1999 average. If the graph shows a positive number, then it is wetter than the 1970-1999 average. If the graph shows a negative number, then it is drier.
- The black line shows the actual precipitation anomaly for each year from 1960 to 2006. This is the difference in rain/ snowfall between the year’s recorded precipitation and the average of all years between 1970 and 1999.
- The brown line shows past precipitation anomalies as produced by a computer model with the brown shading showing the range produced by the model.
- The green, blue and red lines show projected future precipitation from 2006 to 2100, according to three different carbon dioxide emission scenarios – green (low), blue (medium) and red (high). The shading around each line shows the range of precipitation that might be possible with each emission scenario.Average rainfall has not consistently increased or decreased since 1960.
- Models project an overall increase in mean annual rainfall in the UK. The greatest changes will be in the autumn and winter (SON and DJF) and a decrease in rainfall in the summer.
- The range of projections bythe 2060’s is 2-8mm per month and -2 –11 mm per month by the 2090’s.
- Melt water from the Greenland Ice sheet into the North Atlantic is expected to cause a weakening of the Atlantic Ocean Circulation, reducing the effect of the Gulf Stream on the UK and Western Europe climate. This is likely to partially offset the overall warming.
- Coastal regions may be vulnerable to sea-level rise. However, the increases in absolute sea level are partially offset by gradual increase in land elevation in the north of the UK and vice-versa in the south.
McSweeney, C., New, M. and Lizcano, G. (2009) Climate Change Country Profiles – UK. Oxford University School of Geography and Environment and the Tyndall Centre for Climate Change Research. Report commissioned by the British Council, RMetS, RGS-IBG for www.climate4classrooms.org