Question to consider: Adaptation to climate change needs to be addressed in all urban policies. Discuss.
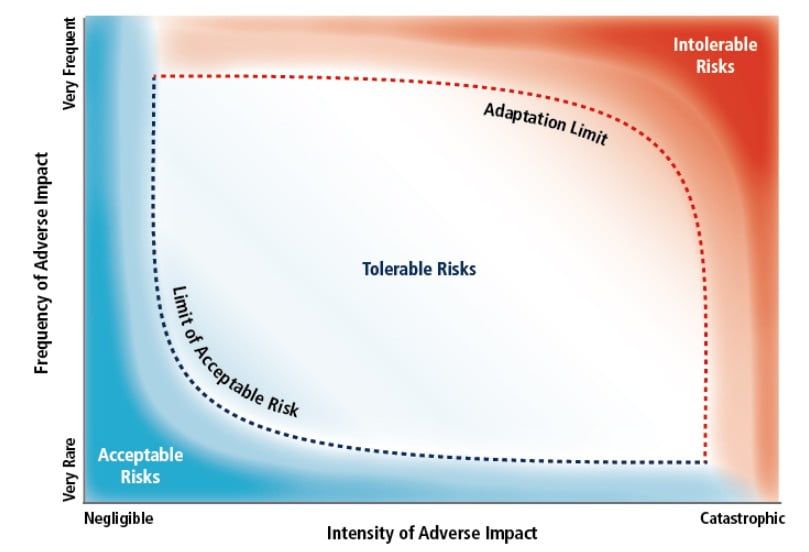
Acceptable risks are those deemed so low that additional efforts at risk reduction, in this case climate adaptation efforts, are not justified. Tolerable risks relate to situations where adaptive, risk management efforts are required and effective for risks to be kept within reasonable levels. The scope of risks that fall within the tolerable area is influenced by adaptation opportunities and constraints. Therefore, the categorization of risks varies across spatial, jurisdictional, and temporal. Opportunities and constraints may be physical, technological, economic, institutional, legal, cultural, or environmental in nature.
Intolerable risks may be related to threats to core social objectives associated with health, welfare, security or sustainability. Risks become intolerable when practicable or affordable adaptation options to avoid escalating risks become unavailable. Therefore, a limit is a point when an intolerable risk must be accepted; the objective itself must be relinquished; or some adaptive transformation must take place to avoid intolerable risk. Such a discontinuity may take several forms such as individual’s decision to relocate, an insurance company’s decision to withdraw coverage, or a species’ extinction. The alternative to such discontinuities is an escalating and unmediated risk of losses. While individuals have their own perspectives about what are acceptable, tolerable or intolerable risks, collective judgements about risk are also codified through mechanisms such as engineering design standards, air and water quality standards, and legislation that establishes goals for regulatory action. There are also international agreements that establish norms and rights relevant to climate change risks, such as the Universal Declaration of Human Rights, the International Covenant on Civil and Political Rights, and the International Covenant on Economic, Social and Cultural Rights. Further, these high level responses often shape the constraints and opportunities to adaptation and responses to risk at lower levels through the distribution of resources, institutional design, and support of capacity development. If these risks and discontinuities have global-scale consequences, they can be linked to ‘key vulnerabilities’ to climate change. Consistent with our framing of adaptation limits, such key vulnerabilities would need to be assessed in terms of the limits they imply for specific social actors, species and ecosystems.
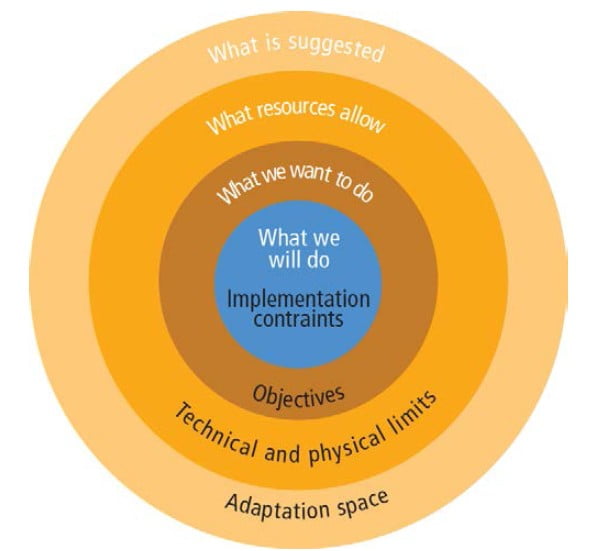
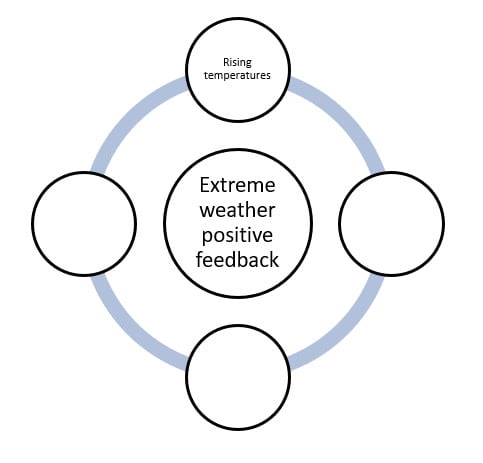
A number of factors will limit strategy adoption and preclude elimination of all climate change effects. The first outside circle represents the “adaptation needs”, i.e. the set of adaptation actions that would be required to avoid any negative effect (and capture all positive effects) from climate change. It can be reduced by climate change mitigation, i.e. by limiting the magnitude of climate change.
The second circle represents the subset of adaptation actions that are possible considering technical and physical limits. Improving what can be done, for instance through research and development, can expand this circle. The area between the first and second circles is the area of “unavoidable impacts” that one cannot adapt to (for instance, it is impossible to restore outdoor comfort under high temperature). The third circle represents the subset of adaptation actions that are desirable considering limited resources and competing priorities: some adaptation actions will be technically possible, but undesirable because they are too expensive and there are better alternative ways of improving welfare (e.g., investing in health or education). This circle can be expanded through economic growth, which increases resources that can be dedicated to adaptation. Finally, the last circle represents what will be done, taking into account the fact that market failures or practical, political, or institutional constraints will make it impossible to implement some desirable actions. The area between the first and the last circles represents residual impacts (i.e. the impacts that will remain after adaptation, because adapting to them is impossible, too expensive, or impossible due to some barriers).
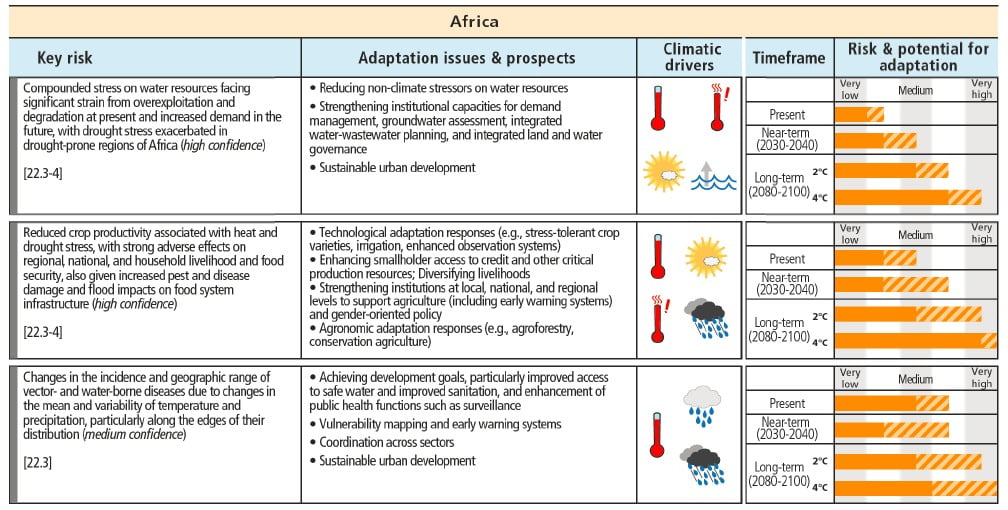
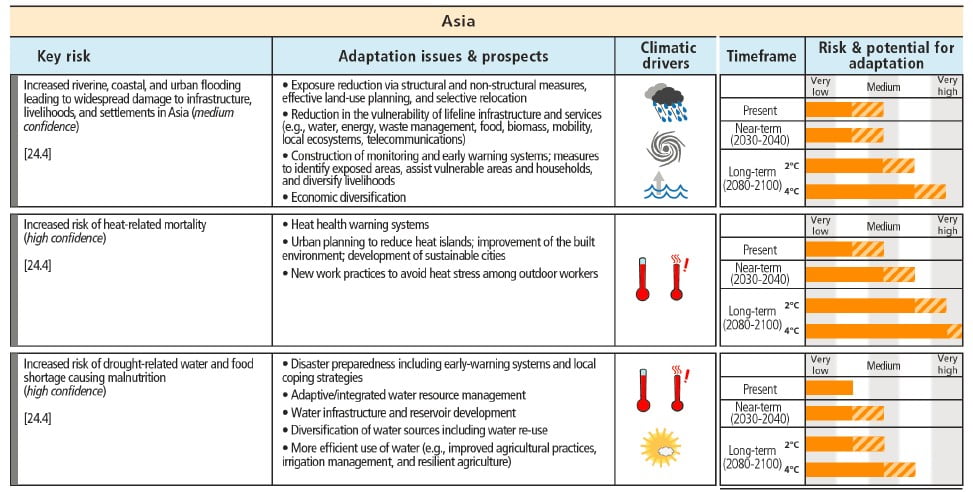
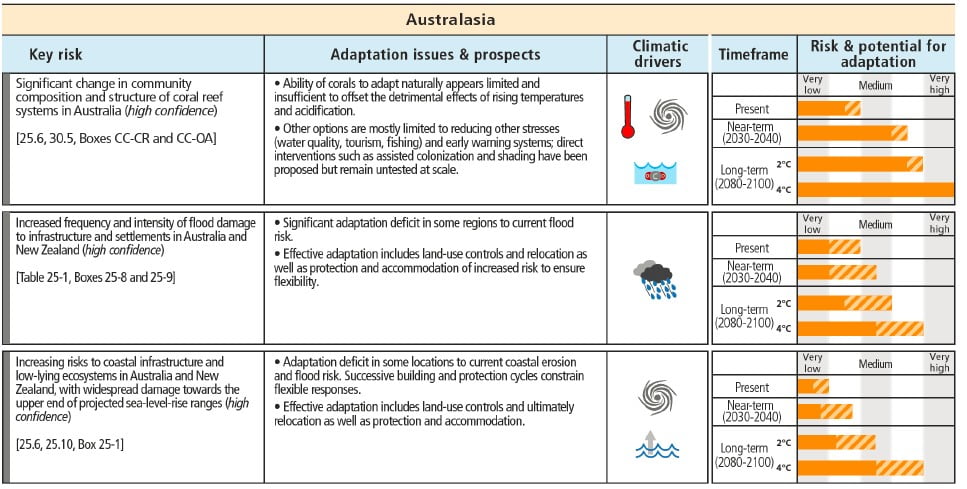
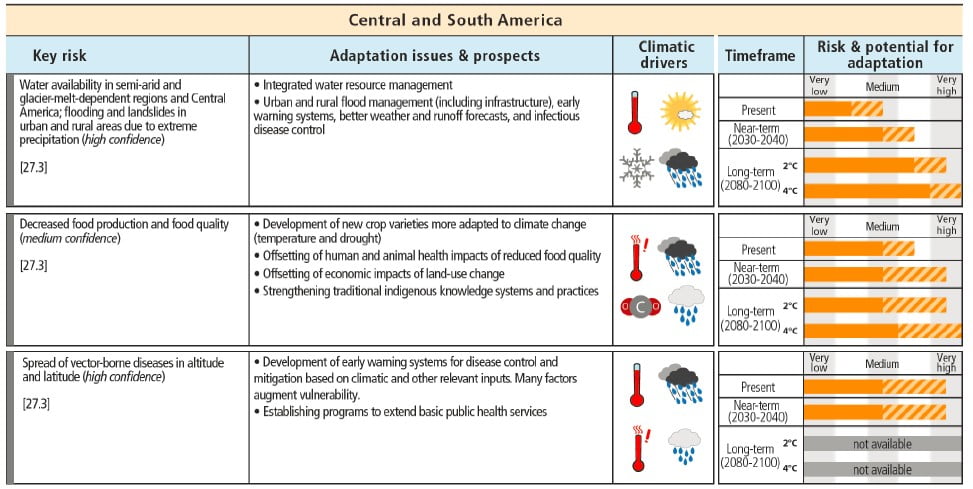
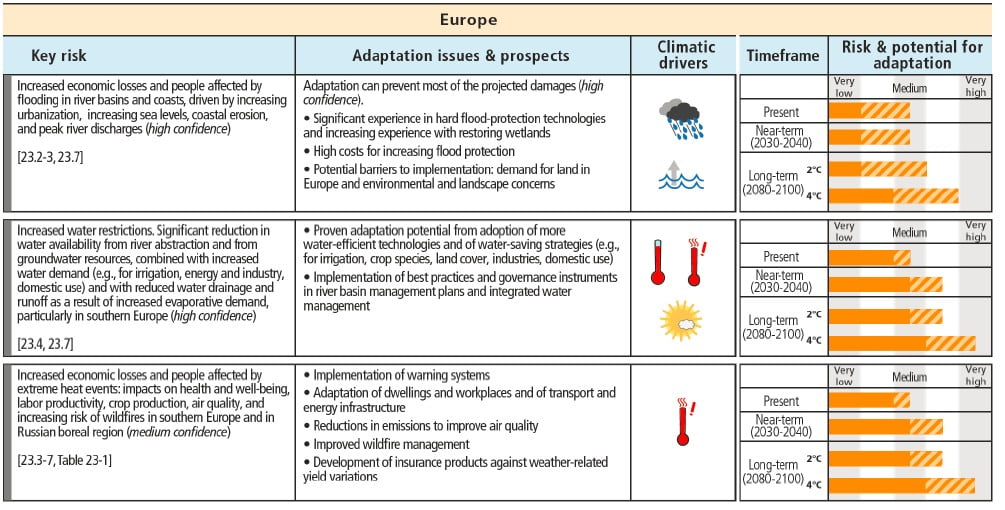
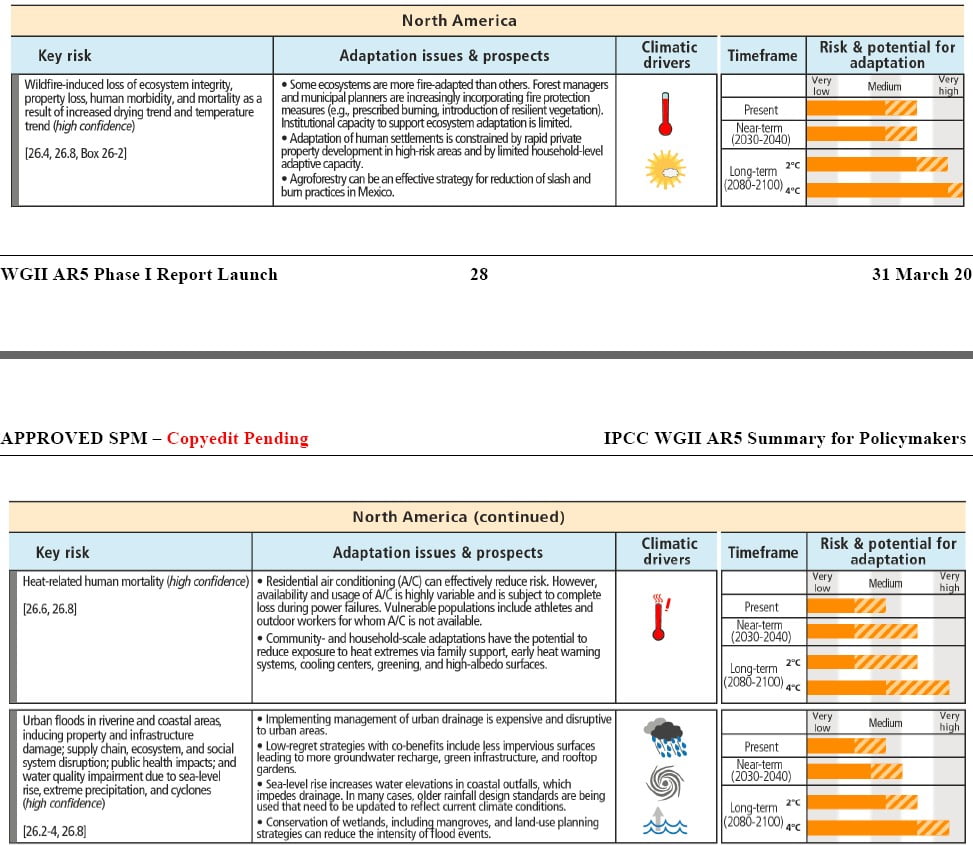
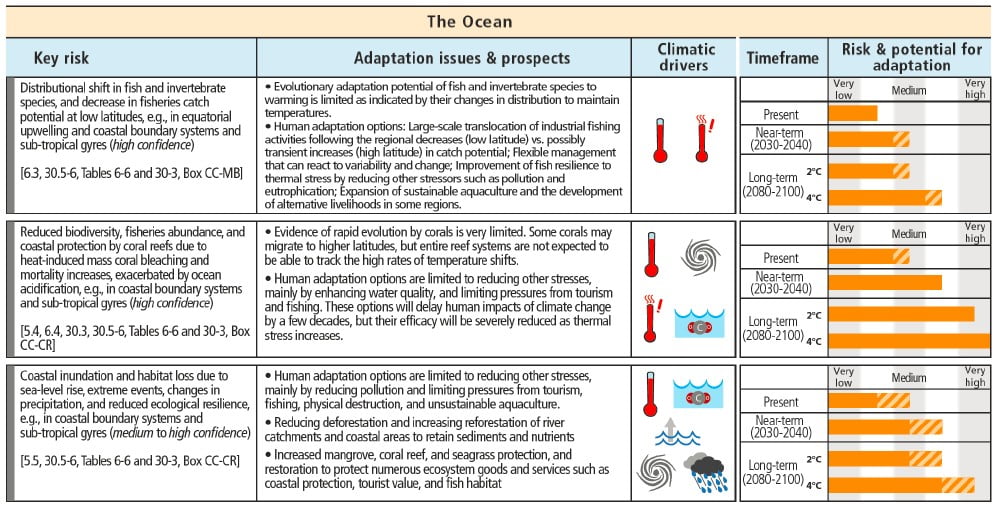
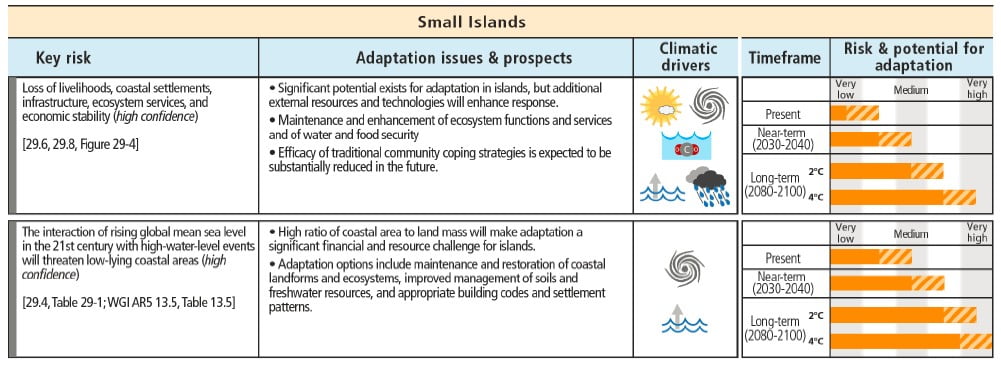
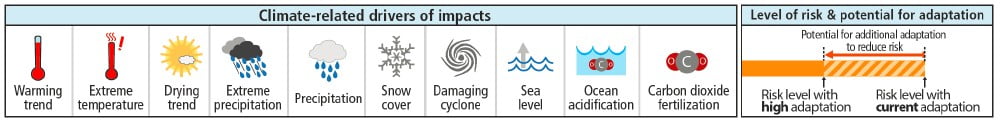
Key regional risks from climate change and the potential for reducing risks through adaptation and mitigation
WG2 Assessment box spm2 table 1: Africa, Asia, Australasia, Central/ South America, Europe, North America, Ocean, Polar Regions, Small Islands, Key.
Could economic approaches bias adaptation policy and decisions against the interests of the poor, vulnerable populations, or ecosystems?
(WG2 FAQ 17.2)
A narrow economic approach can fail to account adequately for such items as ecosystem services and community value systems, which are sometimes not considered in economic analysis or undervalued by market prices, or for which data is insufficient. This can bias decisions against the poor, vulnerable populations, or the maintenance of important ecosystems. For example, the market value of timber does not reflect the ecological and hydrological functions of trees nor the forest products whose values arise from economic sectors outside the timber industry, like medicines. Furthermore some communities value certain assets (historic buildings, religious sites) differently than others. Broader economic approaches, however, can attach monetary values to non-market impacts, referred to as externalities, placing an economic value on ecosystem services like breathable air, carbon capture and storage (in forests and oceans) and usable water. The values for these factors may be less certain than those attached to market impacts, which can be quantified with market data, but they are still useful to provide economic assessments that are less biased against ecosystems.
But economic analysis, which focuses on the monetary costs and benefits of an option, is just one important component of decision making relating to adaptation alternatives, and final decisions about such measures are almost never based on this information alone. Societal decision making also accounts for equity – who gains and who loses – and for the impacts of the measures on other factors that are not represented in monetary terms. In other words, communities make decisions in a larger context, taking into account other socioeconomic and political factors. What is crucial is that the overall decision-framework is broad, with both economic and non-economic factors being taken into consideration. A frequently used decision-making framework that provides for the inclusion of economic and non-economic indicators to measure the impacts of a policy, including impacts on vulnerable groups and ecosystems, is multicriteria analysis (MCA). But as with all decision making approaches, the a challenge for MCA and methods like it is the subjective choices that have to be made about what weights to attach to all the relevant criteria that go into the analysis, including how the adaptation measure being studied impacts poor or vulnerable populations, or how fair it is in the distribution of who pays compared to who benefits.
The impact of 3 urban policies in Paris on climate change adaptation and mitigation
Urban policies have many goals, such as enhancing the quality of life and the city’s economic competitiveness by means of affordable housing and office space, amenities and efficient public services.
They also have social objectives aimed at poverty and social segregation issues, safety and security, and public health and environmental goals, such as reducing air and water pollution and preserving natural areas. Urban policies now also face new challenges from climate change, including adaptation and mitigation needs.
Five possible policy goals:
- Climate change mitigation: reducing greenhouse gas emissions (from transport, heating and air conditioning).
- Adaptation and natural risk reduction: reducing the number of people living in flood prone areas.
- Natural area and biodiversity protection: minimising the total urbanised area.
- Housing affordability: access to affordable housing has impacts on the quality of life and competitiveness of a city.
- Policy neutrality: all geographical areas benefit equally from policies.
The graph below shows the effectiveness of 3 policies in Paris as measured against these policy goals. The three policies are:
1) a greenbelt policy,
2) a public transport subsidy and
3) a zoning policy to reduce the risk of flooding with building prohibited in flood prone areas.
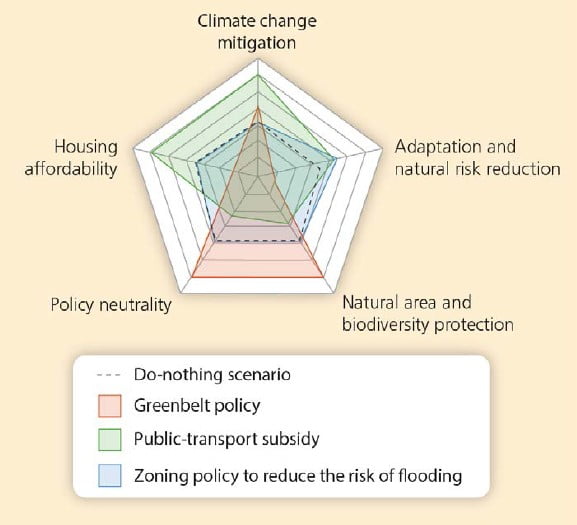
By implementing all three policies, the outcome, considering both positive and negative impacts on the five policy goals, is better than a ‘do nothing scenario’ measured against the five policy goals. Therefore, climate goals can be reached more efficiently and with higher social acceptability, if they are implemented through taking into account existing strategic urban planning, rather than by creating new, independent climate-specific plans.
Additional Source:
Trade-offs and synergies in urban climate policies, V. Viguié & S. Hallegatte, Nature Climate Change 2, 334–337 (2012), doi:10.1038/nclimate1434


